
Setting Stop Loss and Take Profit Levels
On this page
Placing a stop-loss from a risk amount
Most traders place a stop-loss first by looking at chart structure — a recent swing low, a support level, or a technical invalidation point — and that is the right starting point. But once you know the position size you intend to trade, you can also work backwards: decide how much money you are willing to lose, and calculate exactly how far away the stop-loss needs to be for that loss to match your intended risk.
Risk Amount = Account Balance × (Risk % / 100)Stop Distance = Risk Amount ÷ Position SizeLong:
Stop-Loss = Entry − Stop Distance · Short: Stop-Loss = Entry + Stop Distance
This calculation is most useful as a cross-check: after choosing a stop-loss from chart structure, verify that the resulting position size still keeps your risk at the intended percentage. If the structural stop is too far away, the fix is to reduce position size — not to ignore the structure.
Keep in mind that a stop-loss order sets the price at which an exit is triggered, not the price at which it is guaranteed to fill. In fast-moving markets, or when a market opens with a gap after news or a weekend, the price can jump past your stop level before an order can be filled — this is called slippage, and it means your actual loss can be larger than the calculated figure above. Guaranteed stop orders, where offered, remove this risk for a fee; standard stops do not.
Placing a take-profit from a ratio
A take-profit level can be derived directly from your risk distance and a target risk/reward ratio, which keeps trade planning consistent across setups:
Reward Distance = Risk/Reward Ratio × |Entry − Stop-Loss|Long:
Take-Profit = Entry + Reward Distance · Short: Take-Profit = Entry − Reward Distance
As with stop-loss placement, this is a planning tool, not a substitute for reading the chart. A calculated take-profit that lands in the middle of strong resistance, for example, may be unrealistic — it is often adjusted to the nearest sensible technical level near the calculated price.
Worked example
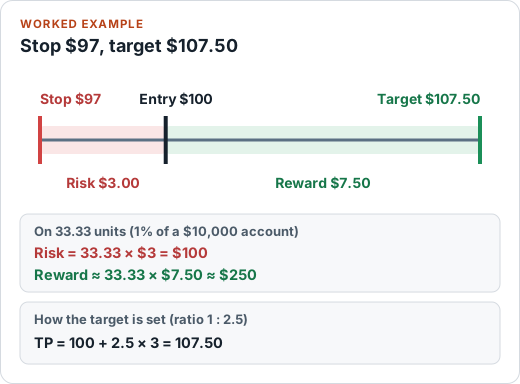
You go long at $100 with a structural stop-loss at $97 (a $3 risk distance) and you want a 1:2.5 risk/reward ratio.
- Reward Distance = 2.5 × $3 = $7.50
- Take-Profit = $100 + $7.50 = $107.50
If your account is $10,000, you're risking 1%, and your position size is 33.33 units (from the position size example), your dollar risk is $100 and your potential reward is 33.33 × $7.50 ≈ $250 — a 1:2.5 payoff matching the ratio you planned.
Where the stop goes before you size the trade
The calculators work backwards from a stop price you have already chosen. Choosing it is a separate judgment, and the common approaches differ in what they assume:
- Structure-based: beyond a level that, if broken, shows the idea was wrong, such as below a recent swing low for a long trade. The distance is whatever the chart gives you.
- Volatility-based: a multiple of a recent average range, so the stop adapts when the market becomes more or less volatile.
- Percentage-based: a fixed percentage from entry. Simple, but it ignores how that particular market moves.
Whichever you use, fix the stop first and let the position size absorb the difference, as the position size guide explains. None of these methods guarantees the stop will survive normal price movement, and in a fast market or across a gap, the order can fill beyond the stop price.
Once the stop exists, targets follow from multiples of the distance you are risking. For a long trade entered at 250 with a stop at 247 (a distance of 3.00), the target at each multiple is:
| Target multiple | Distance from entry | Target price |
|---|---|---|
| 1 R | 3.00 | 253.00 |
| 1.5 R | 4.50 | 254.50 |
| 2 R | 6.00 | 256.00 |
| 3 R | 9.00 | 259.00 |
Trailing stop-loss: how the level moves
A trailing stop-loss follows price at a fixed distance once the trade moves in your favour, and it never moves back against you. For a long trade, the stop is the highest price reached since entry minus the trail distance. For a short trade, it is the lowest price reached plus the trail distance. A percentage trail uses highest price × (1 − trail %) for a long.
Example: you buy at $100 with a $5 trail, so the first stop is $95. Price rises to $112 and the stop moves to $107. Price rises to $115 and the stop moves to $110. Price then dips to $111; the stop stays at $110. If price falls to $110, the trade closes for about $10 per unit before costs and slippage.
SOFTYTOOLS does not have a separate trailing-stop calculator, because the trailing level is simple arithmetic once you have a trail distance. Use the stop loss calculator to set the initial stop from your risk amount, then trail it with the rule above. Platforms differ in whether they trail on last price, bid or ask, so confirm how your broker applies it. In a fast market the order can fill beyond the stop price.
Common mistakes
- Moving the stop-loss further away mid-trade. This changes the actual risk taken and usually happens under emotional pressure rather than as a planned decision.
- Setting a take-profit with no relation to the stop-loss. Without a defined ratio, it becomes hard to evaluate a strategy's performance systematically.
- Treating calculated levels as exact chart levels. Formulas give you distances and prices to work from — always sanity-check them against the actual chart before placing an order.
Frequently asked questions
Should I set my stop-loss based on a dollar amount or chart structure?
Ideally both — use chart structure to decide where the trade idea is invalidated, then use a dollar-based calculation to confirm the resulting position size keeps your risk at an intended percentage.
Can I set a take-profit without a risk/reward ratio?
Yes, many traders set take-profit at a specific technical level instead. Using a ratio simply makes it easier to compare and evaluate different trades consistently over time.
What happens if my calculated stop-loss is below zero?
This usually means the risk percentage or position size entered is too large relative to the entry price — reduce one of them so the calculated stop-loss stays at a realistic, positive price.
Is there a trailing stop loss calculator?
Not as a separate tool. Set your initial stop with the stop loss calculator, then trail it by hand: for a long trade, stop = highest price since entry minus your trail distance. The trailing stop-loss section has a worked example.
Try the Stop Loss & Take Profit Calculators
Related guides and tools
- Run your own numbers in the stop loss calculator, or browse all trading calculators.
- Read How to Calculate Position Size to size the trade so the stop-loss costs only what you intend.
- Read Risk/Reward Ratio Explained to see how your target compares with your risk.
- Read Risk Management in Trading for the wider system your stop-loss belongs to.
- Read the Trading Risk Percentage guide to check what a given stop distance really risks.
- See every topic in the guides library.
- Work out the result of scaling out with the partial close calculator.
- Convert a stop distance in pips into money with the pip value calculator.
About the author
SOFTYTOOLS Editorial Team writes and maintains the calculators and guides on this site, focusing on clear, formula-based explanations of trading and investing concepts rather than opinion or speculation.