
Position size: turning a risk budget into a share count
Inputs: account balance, the percentage of it you are willing to lose if the stop is hit, entry price and stop-loss price (all in the same currency units), and optionally the units per lot.
Example: a $25,000 account risking 0.5% on a share bought at 48.20 with a stop at 46.90. The risk amount is $125.00, the stop distance is 1.30, so the position is 125.00 ÷ 1.30 = 96.1538 shares, worth about $4,634.62.
Reading it: brokers rarely allow fractions, so round down. 96 shares risk 96 × 1.30 = $124.80, just inside the budget; 97 shares would risk $126.10, just over it. The size is only as reliable as the stop: a gap through the stop price can make the real loss larger. The position size guide explains the method in more depth.
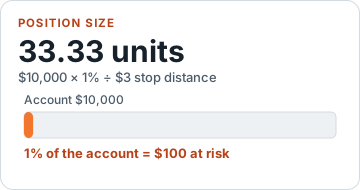
Forex lot example: a $10,000 account risking 1% ($100.00) on EUR/USD, with entry at 1.0850 and a stop at 1.0820, so the stop distance is 0.0030. The position is 100.00 ÷ 0.0030 = 33,333.33 units. With units per lot set to 100,000 (a standard forex lot), that is 0.3333 lots; round down to the lot step your broker allows. Set units per lot to match the instrument: 100,000 for a standard forex lot, or 1 if you trade shares or coins in single units. This example works because the account is in dollars and EUR/USD is quoted in dollars. Spread, commission and slippage are not included, and a different quote currency, a tick value or a contract multiplier means converting the price risk into your account currency first. The pip value calculator helps with forex pairs.
Trading risk %: checking a trade you have already planned
Inputs: balance, entry, stop and position size in units.
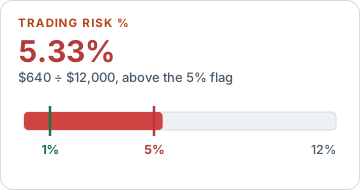
Example: a $8,000 account buys 20,000 units of EUR/USD at 1.0850 with a stop at 1.0820. The loss if stopped is 0.0030 × 20,000 = $60.00, which is 0.75% of the account.
Reading it: capping the share of the account that any single trade can lose is the core of what many traders call money management, so compare the percentage with the limit you set yourself. This calculator treats one unit of price movement as one unit of your account currency, which holds here because the account is in dollars and EUR/USD is quoted in dollars. For other pairs, convert first with the pip value calculator. The trading risk percentage guide discusses how to choose the limit itself. For how sizing and risk rules fit together, see position sizing vs risk management.
Risk/reward: how much you stand to make for each unit risked
Inputs: entry, stop-loss and take-profit prices.
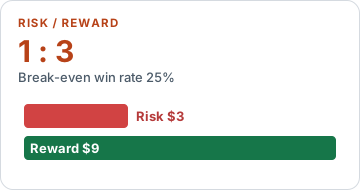
Example: entry 1.0850, stop 1.0820, target 1.0910. Risk is 0.0030, reward is 0.0060, so the ratio is 1 : 2.00 and the break-even win rate is 0.0030 ÷ (0.0030 + 0.0060) = 33.33%.
Reading it: you would break even, before costs, by winning about one trade in three. The ratio describes the payoff only; it says nothing about how likely the target is to be reached, and spreads or commissions raise the win rate you really need. See the risk/reward ratio guide.
Stop loss: the price that matches your risk budget
Inputs: balance, risk %, entry price, position size and direction.
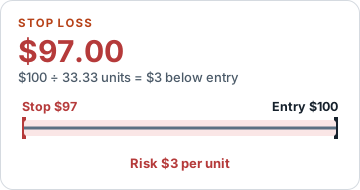
Example: a $12,000 account risking 1% ($120.00) on 40 units bought at 250.00. The stop distance is 120.00 ÷ 40 = 3.00, so a long stop sits at 247.00.
Reading it: treat the result as a limit, not a prediction. If a stop at 247.00 sits inside the price noise of that market, the fix is a smaller position, not a tighter stop that is hit more often. The stop-loss and take-profit guide covers where stops can be placed.
Take profit: a target from a chosen ratio
Inputs: entry, stop-loss, the ratio you want and direction.
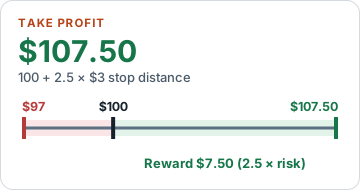
Example: continuing the same trade (entry 250.00, stop 247.00) with a 1 : 2 ratio, the reward distance is 6.00 and the long target is 256.00. On 40 units that is $240.00 of potential reward against $120.00 of risk.
Reading it: a target is only worth using if the chart gives a plausible reason for price to reach it. A ratio chosen purely for its appearance can place the target beyond where the market tends to travel. The same guide has a table of targets for common multiples.
Leverage: exposure compared with your own capital
Inputs: account equity and position value; in the second mode, a leverage multiple.
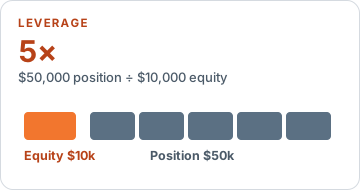
Example: $5,000 of equity holding a $40,000 position is 8.00× leverage. Planning the same position at 10× needs $4,000 of margin, and $5,000 of equity at 10× could carry at most $50,000.
Reading it: margin is collateral held by the broker, not the amount you can lose. What you can lose is set by the stop and the position size. See the leverage and margin guide and the liquidation price calculator.
Drawdown: how far the account has fallen and what recovery takes
Inputs: the account peak and the current (or lowest) value.
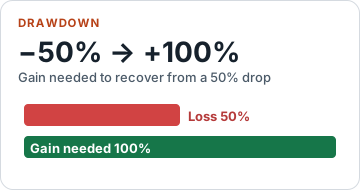
Example: a peak of $20,000 that has fallen to $15,000 is a 25.00% drawdown, a $5,000 loss, and needs a gain of 33.33% from the lower balance to get back to the peak.
Reading it: recovery needs a bigger percentage than the loss because the gain applies to a smaller base. That asymmetry is why many traders set a drawdown limit that pauses trading; the drawdown guide shows how.
ROI: profit relative to what you put in
Inputs: initial investment, final value and, optionally, the holding period in days.
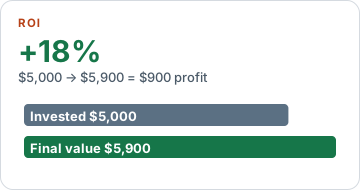
Example: $4,000 grown to $4,900 is a $900 profit, an ROI of 22.50%. Held for 200 days, the annualised figure is (4,900 ÷ 4,000)^(365 ÷ 200) − 1 = 44.83%.
Reading it: annualising repeats a short period as if it would continue, which can exaggerate. Use it to compare holdings of different lengths, not to predict a year. The result also ignores money added or withdrawn along the way. The ROI guide covers these limits and how to adjust for them.
Compound investment: growth with regular contributions
Inputs: starting amount, contribution per period, annual rate, years and how often it compounds (contributions follow the same frequency).
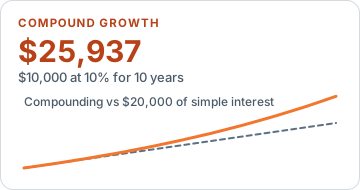
Example: $5,000 to start, $200 added each month, 7% a year for 10 years, compounded monthly: a final value of $44,665.27, of which $29,000 is money you contributed and $15,665.27 is interest.
Reading it: a fixed rate is an assumption, not an expected return; real returns vary and can be negative. Try several lower and higher rates to see a range rather than a single answer. The compound growth guide explains why projections mislead.